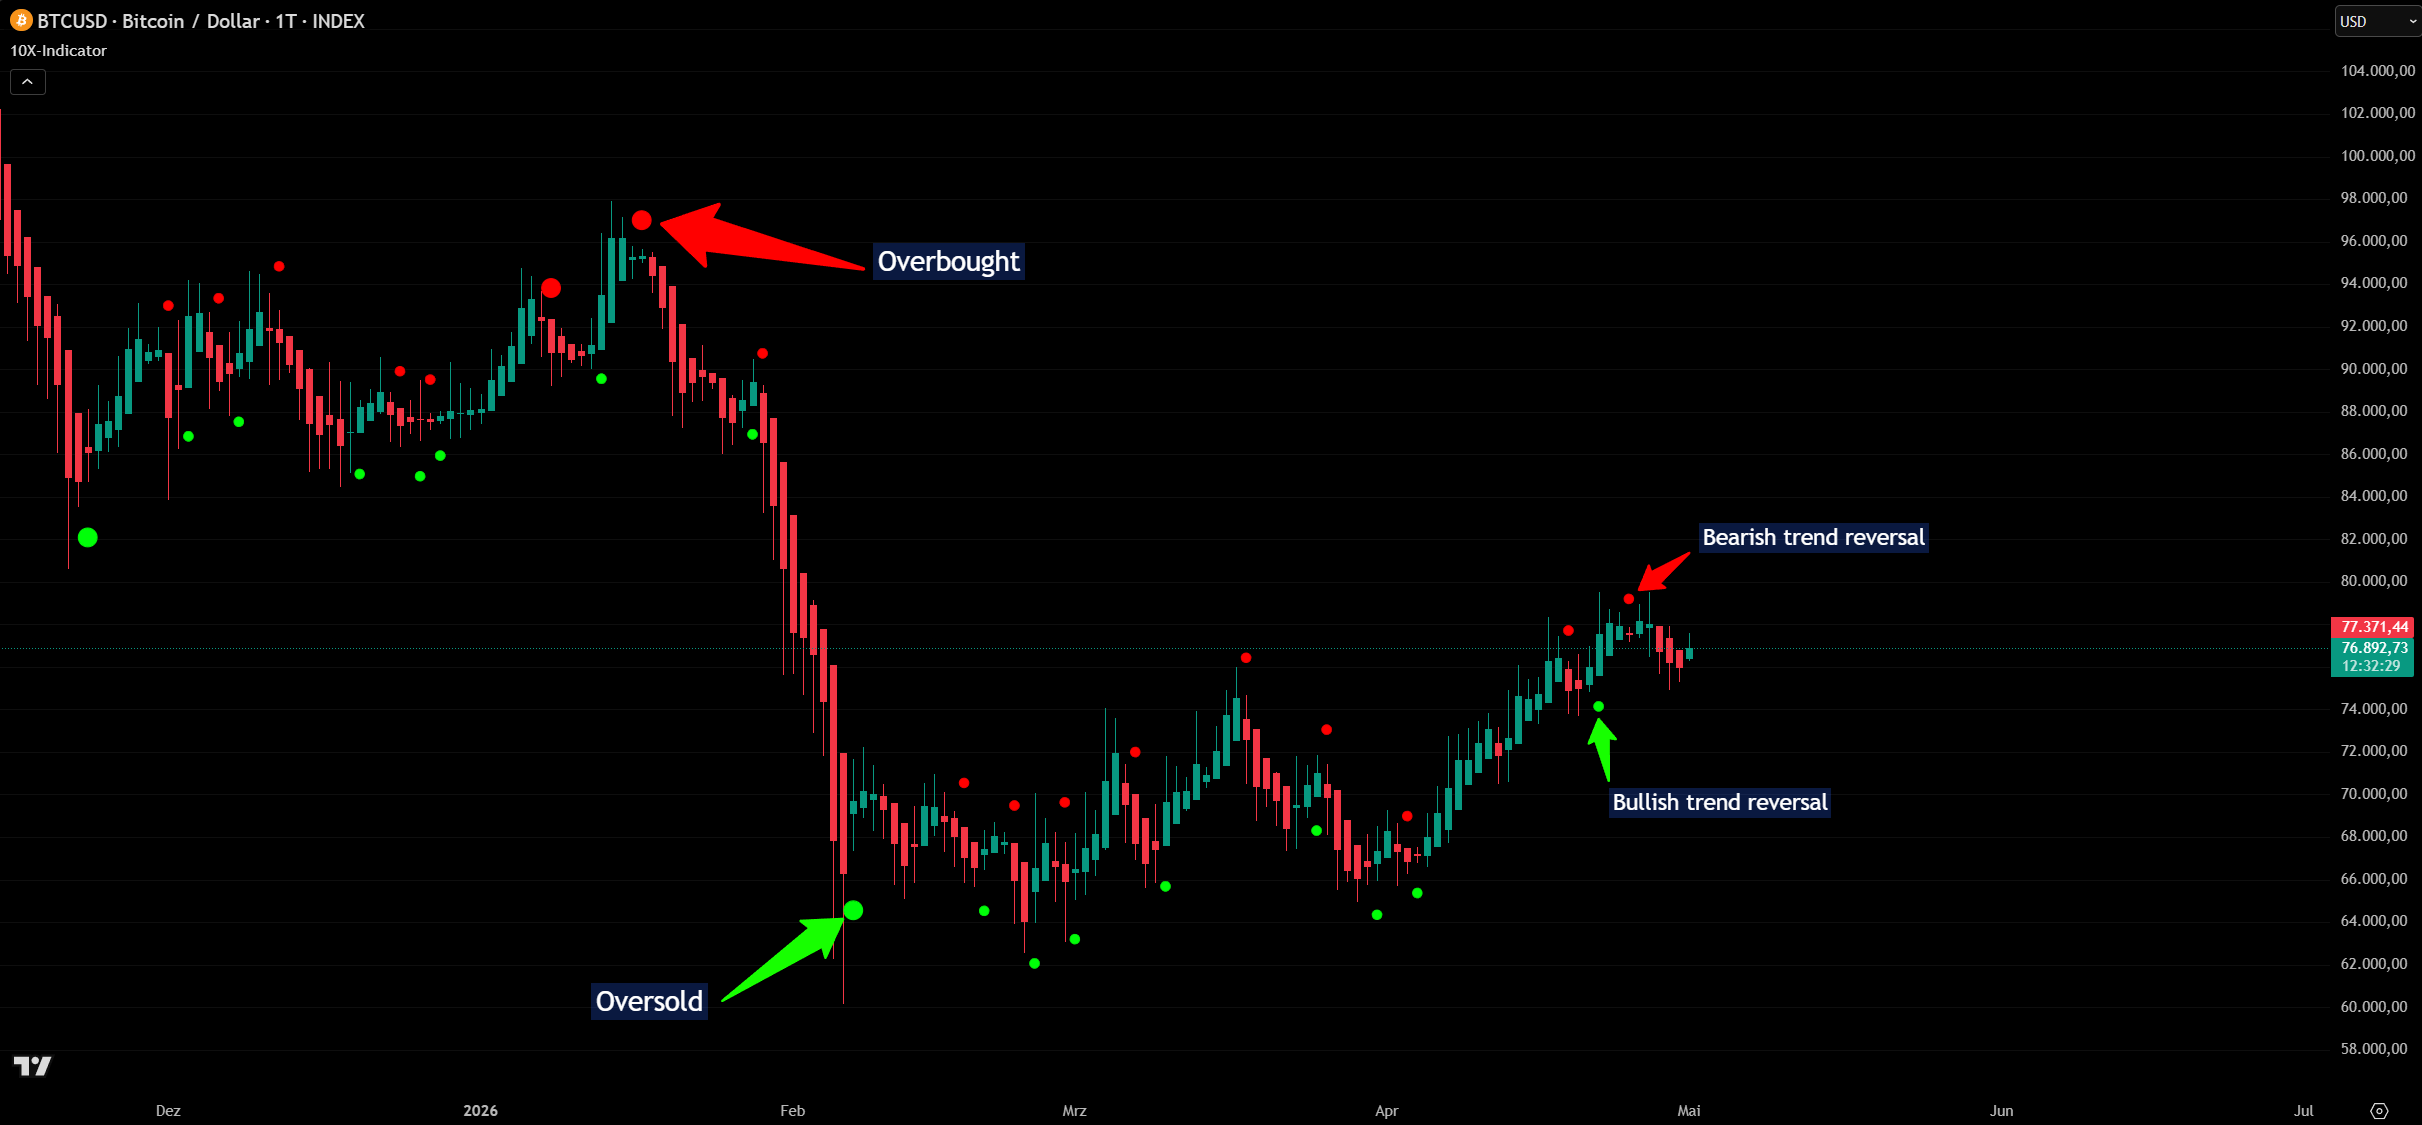
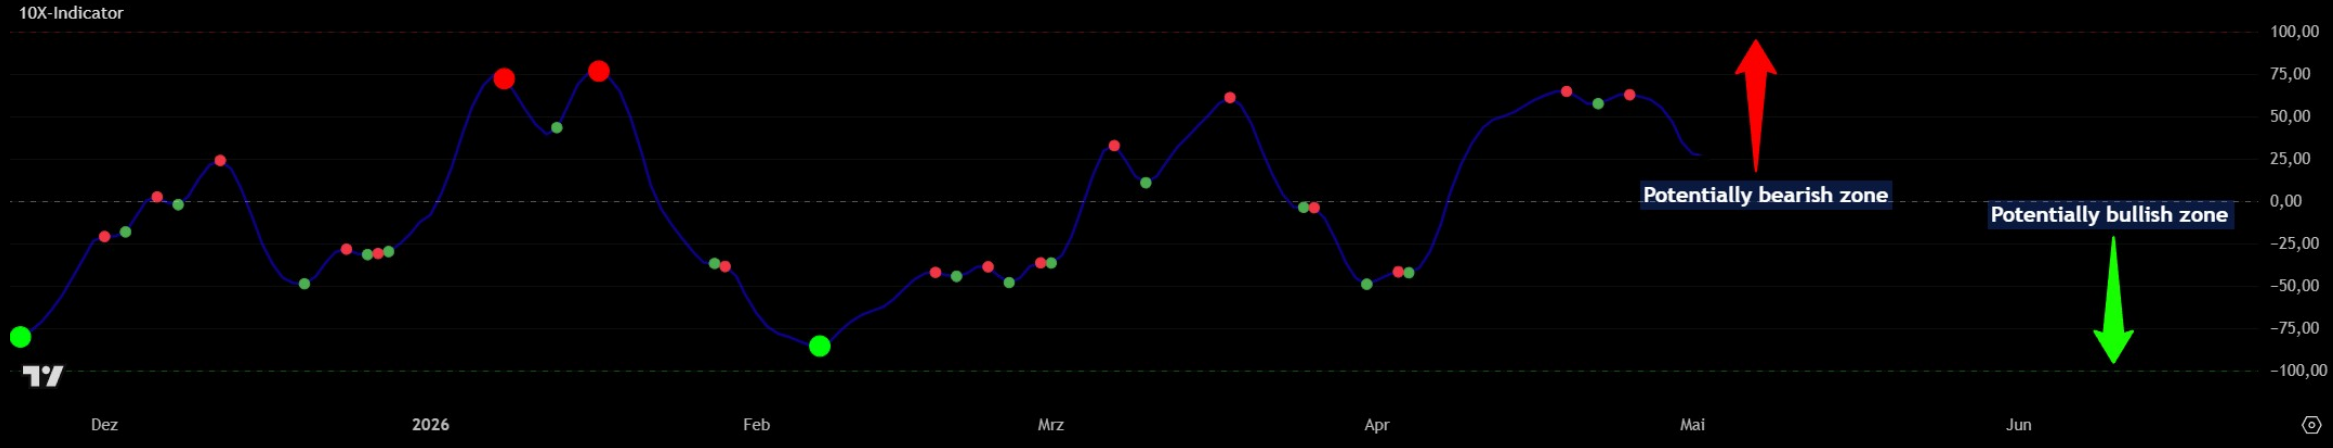
Most indicators overload you with information and make clear decisions harder, not easier. The 10X-Indicator reduces the chart to what matters and shows relevant context directly & clearly at a glance.
Crypto · stocks · gold · silver · ETFs · on TradingView
Get it now →From $149 / 6 months · Instant access
In a few minutes I'll show you how the indicator works on TradingView and how you use it.
My personal strategy as an example: save every month. On a large green dot, consider investing. Real historical markers from TradingView. Not investment advice.
All markers appear as dots directly below the chart. Instantly recognizable, no interpretation needed.
The big green dot marks oversold zones on Bitcoin. Here is the historical evaluation since 2015.
Note: Historical evaluation BTC/USD, daily chart, from 2015 onwards. 34 data pairs evaluated. The rate refers exclusively to the indicator's pattern recognition, not to gains or losses. Past results are no guarantee of future performance. Not a buy or sell recommendation.
Works on all assets on TradingView.
From $149 / 6 months · No risk · Instant access
No hidden costs. All prices excl. VAT.
All prices in USD · excl. VAT · Exclusively for TradingView
Secure payment
Originally posted on the German 10X-Analytics Whop · translated for English readers
"Finally clarity in the crypto jungle. Clear facts instead of empty talk. Your weekly updates are worth their weight in gold!"
"Your analyses are worth their weight in gold. Absolutely top work and worth every cent."
10X-Elite includes the 10X-Indicator plus personal insight into my model portfolio and educational watchlist, my data-based evaluation framework, the Telegram BTC Alert and the 10X-Academy. For ~$24 more per month you get the complete method.
For anyone working with charts who wants a faster structured insight, beginners and experienced. Also for anyone who does not want to analyze charts and simply wants to be notified via Telegram.
Since 2015, in 79% of cases a big green dot on Bitcoin was followed by an actual bottoming phase (27 out of 34 markers, BTC/USD daily chart). Note: historical evaluation, no guarantee of future results and not a buy or sell recommendation.
No. The indicator shows technical markers, not buy or sell recommendations. All decisions are made by the user.
The indicator is optimized for the daily chart but can be used on other timeframes.
As soon as an indicator dot (big or small, green or red) appears on the Bitcoin daily chart, you automatically receive a Telegram message. Ideal if you do not monitor charts daily.
Yes. The indicator works on all assets on TradingView: crypto, stocks, ETFs, gold, silver and more.
Technical markers at a glance. For crypto, stocks, gold and silver. Instant access.
Get it now →5.0 ★★★★★ · Rated on Whop